
價格:免費
更新日期:2019-02-06
檔案大小:14 MB
目前版本:1.1
版本需求:需要 iOS 10.0 或以上版本。與 iPhone、iPad 及 iPod touch 相容。
支援語言:英語
In probability theory, a log-normal (or lognormal) distribution is a continuous probability distribution of a random variable whose logarithm is normally distributed. Thus, if the random variable Y is log-normally distributed, then ln(X) has a normal distribution. Likewise, if Y has a normal distribution, then X = exp(Y) has a log-normal distribution.
For Data Entry the Laplace Distribution app utilizes three Sliders.
The First Slider enters the Random Variable (x). The range of the Random Variable (x) is 1.0 to 12.0.
The Second Slider enters the Standard Deviation (σ) value. The range of the Standard Deviation is 1.0 to 4.0
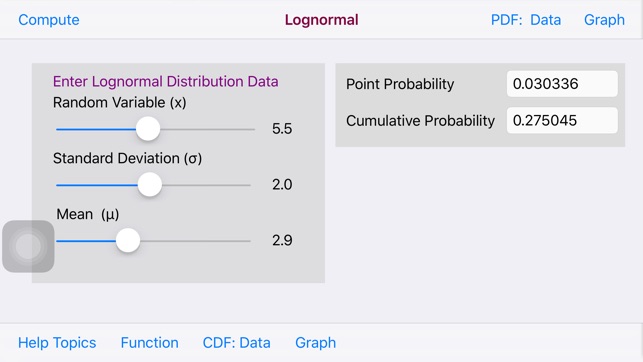
The Third Slider enters the Standard Mean (μ) value. The range of the Standard Deviation is 1.0 to 8.0.
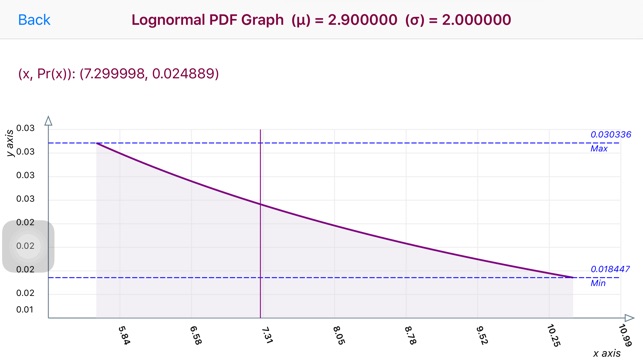
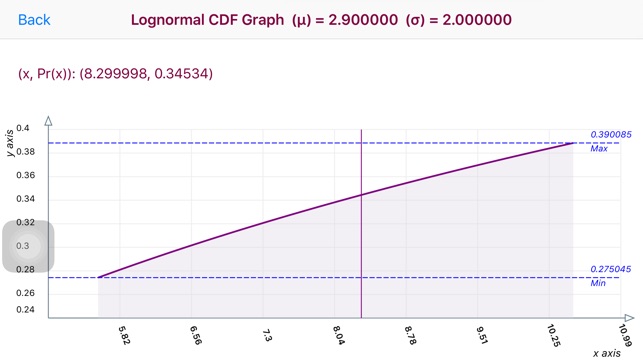
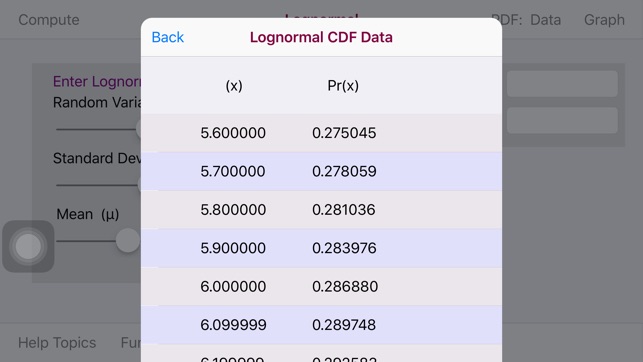
The Lognormal PDF graph displays (x/Pr(x)) data pairs. The graph is a touch enabled graph. Upon touching the graph a vertical line appears. Move the vertical line to the left or right to display the point (x/Pr(x)) data in the upper left of the graph.
The horizontal x-axis displays x values. The vertical y-axis plots a range of Pr(x) values.
Horizontal Max and Min dashed lines display the Maximum and Minimum Pr(x) values

支援平台:iPhone, iPad