
價格:免費
更新日期:2019-06-09
檔案大小:19.2 MB
目前版本:2.7
版本需求:需要 iOS 8.1 或以上版本。與 iPhone、iPad 及 iPod touch 相容。
支援語言:英語
About SpiderChart Pro
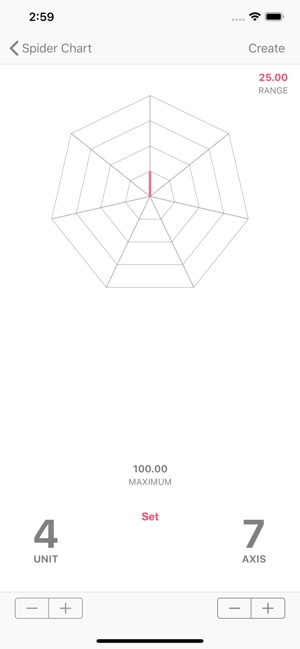
SpiderChart Pro enables user to create dynamic and customized radar charts on the go. It features complex animations and graphics to distinguish elements in a timely manner. The app allows the user to save, edit and share final reports across multiple devices. It also supports iCloud backup. Our goal is to make the user’s interface as simple and efficient as possible by following the iOS Human Interface Guidelines.
What is Spider Chart?
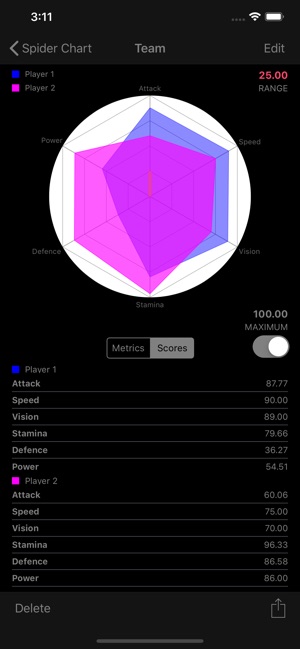
Spider Chart, also known as radar chart, is a graphical way of presenting multivariate data in the form of a two dimensional chart of three or more quantitative variables represented on axes starting from the same point. Spider Chart showcases the strengths and weaknesses of multiple categories, typically between five to ten organizational performance areas.
When to use Spider Chart?

Spider Chart can be used to evaluate and compare the performance of multiple organizational areas. The chart enables the users to make educated decisions by providing a realistic and comparative picture of performance levels throughout an organization or a project's life cycles (i.e. performance of departments, vendors, or staff members)
Where to use Spider Chart?
Spider Chart can be used in a variety of business applications, such as product comparison, or analysis of employees's performance/skill set. It can also be utilized by consultants to compare companies or products. Spider Chart provides a simple yet effective method to assess the quality improvement of products or projects. In addition, Spider Chart can be used in coaching and sports to display athletes’ strengths and weaknesses.
How to develop Spider Chart?
- Identify the variables to be compared
- Define criteria to rate each variable
- Rate each variable based on defined criteria
- Draw and label the chart's axis
- Analyze the results
Useful Tips:
-Standardize ratings to some uniform scale (0-10 or 0%-100%)
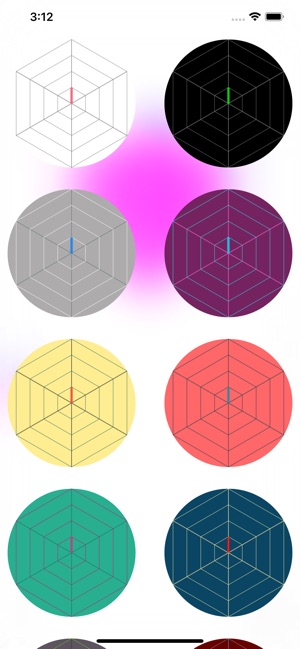
-Use different colors for each alternative

支援平台:iPhone, iPad