
價格:免費
檔案大小:47.2 MB
版本需求:需要 iOS 11.0 或以上版本。與 iPad 相容。
支援語言:英語
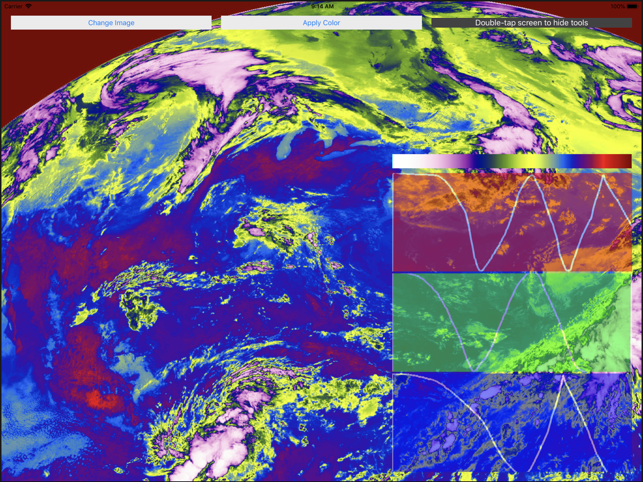
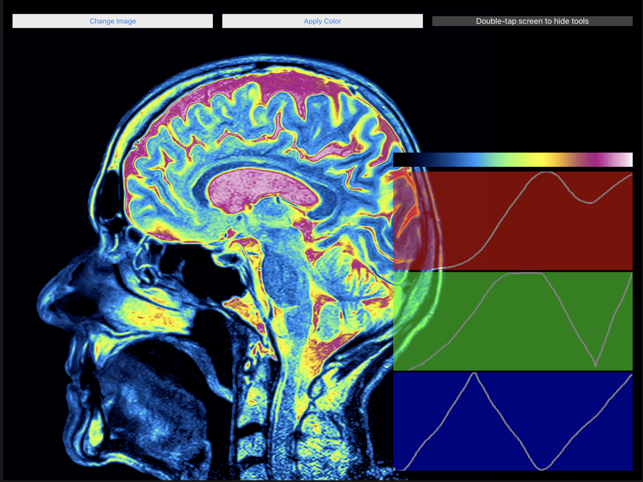
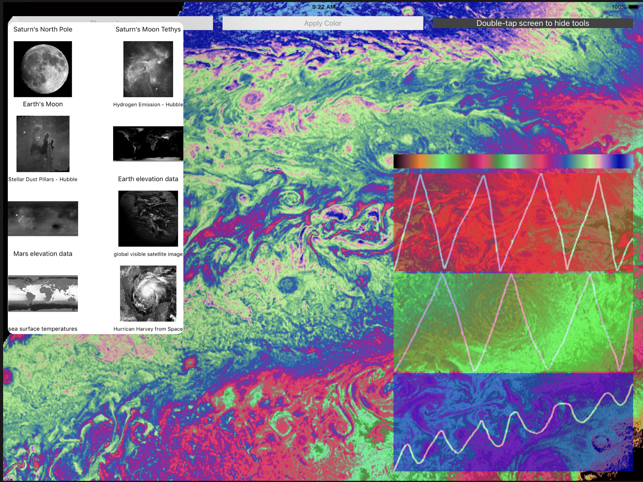
Create visualizations of data from space probes and satellites, digital earth and mars elevation data, MRI and ultrasound imagers. Students will learn how colors are mapped to information in order to create beautiful visualizations that help us learn as much as much as we can from the data.
Students can play and experiment with the app, create custom color palettes, and pan and zoom the images to highlight certain regions of the images.
For specific practice, try creating these specific visualizations:
1) Create a visualization of the sea surface temperature image that uses as many warm colors as possible for warm, tropical water, and as many cool colors to depict the more polar water temperatures.
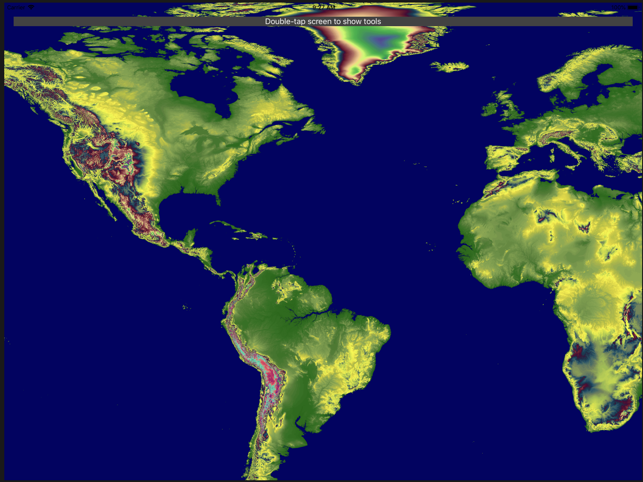
2) Create a photo-realistic image representing the world’s elevations. Mountains should look snow-capped, water should be blue, lower elevations should range from light-green, to dark green, to browns, etc. The elevation image is very detailed and large so it takes a long time to render. Be patient, the wait is worth it. Play with other images first until you are good at creating palettes before trying this super detailed image.
3) An extremely detailed color palette for the world’s elevation that shows off the Mississippi River valley in as much detail as you can.
4) Use any other image you choose and make something that has artistic value. Be creative and send screenshots to your friends of the work you create!
支援平台:iPad