價格:免費
更新日期:2019-12-30
檔案大小:61.2 MB
目前版本:1.0.7
版本需求:系統需求:iOS 8.0 或以後版本。相容裝置:iPhone、iPad、iPod touch。
支援語言:英語

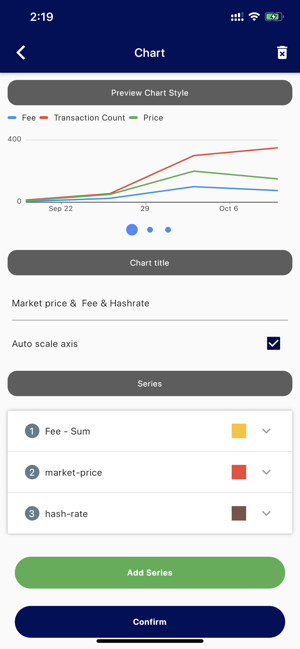
At present, data analysis is playing an increasingly important role in the crypto market. In particular, various types cryptocurrency data and their prices may show some correlation. This app is to generate and compare data charts through multiple dimensions to allow you to track block data and the relationship between them so as to discover the hidden secret behind the change of prices.
Features:
Data analysis with different sources and dimensions, which includes
1.On-chain data
2.Trading market prices
3.Social activity data
4.Search Heat Index (Google Trends)
5.Fear and Greed Index (Alternative.me)
Customizable parameters for on-chain data:
1.Specified address, block, and transaction etc.
2.Specified date or block interval
3.Calculation of the total, average, maximum, and variance of statistical values.
4.Specified statistical units

Chart type
1.Line Chart
2.Bar Chart
3.Dot Chart
4.Pie Chart
Statistics series overlay
Multiple reusable series are shown in a chart analyze the correlation between them. Note: Usage of reusable series is not charged.
Cloud computing
The on-chain data comes from real-time cloud computing, and third-party data is free to use.
About In-App-Purchase and Points
Because cloud computing consumes computing resources, each unused series under the account will be charged with 1 point which can be obtained through In-App-Purchase.
Export and share
We support exporting via image format and csv raw data.

Should you have any questions, please feel free to contact us at support@xcoinchart.com.

