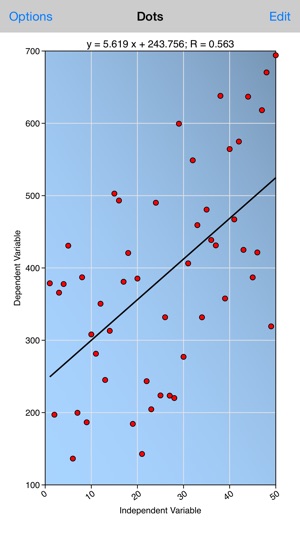
Least Squares computes and displays linear regression of 2D points. Touch the Edit button to enter 2
看更多 »VVI
Scatter Graph
Scatter Graph shows scatter and trajectory representations of 3D points. Touch the Edit button to en
看更多 »Vvidget
Vvidget: "You give it data and it gives you a graph." It does that by providing general purpose grap
看更多 »Graph
Graph is straightforward:• Makes graphs from numbers.• Made by the data visualization expert - VVI®.
看更多 »Graph Code
Graph Code parses and runs a script into animated graphs and other graphics. It comes with one defau
看更多 »Graph IDE
Graph IDE™ Highlights:• Has unique graph types never found in alternatives as well as standard graph
看更多 »Graph VR
Graph VRGraph VR™ uses a 3D VR headset (purchased separately for about $30) to visualize 3D perspect
看更多 »Health Graph
Health Graph shows your weight and blood pressure on a trend graph. Touch the Edit button to enter w
看更多 »Run 'n' Graph
Run 'n' Graph makes a course diagram, speed histogram and speed trend graph while you run. I
看更多 »Error Bars
Error Bars is used to show error bar data, aka: low/high/close data. It also shows low/high/close tr
看更多 »


